High and low temps, Burlington, Vermont, 2024
Two years ago I began a project to record the high and low temperatures for Burlington, Vermont (the closest National Weather Service reporting location). I was inspired by the Tempestry Project, which for years now has been promoting the visualization of climate data in knitting and crochet. I decided to spin off the idea into needle felting.
I began by using the palette of yarns originally developed by the Tempestry Project and available from KnitPicks. The Tempestry Project has since developed their own line of yarns, but I had invested heavily in the KnitPicks yarns (Wool of the Andes), and so I began there.
Each color represents a 5-degree temperature span, as shown below.
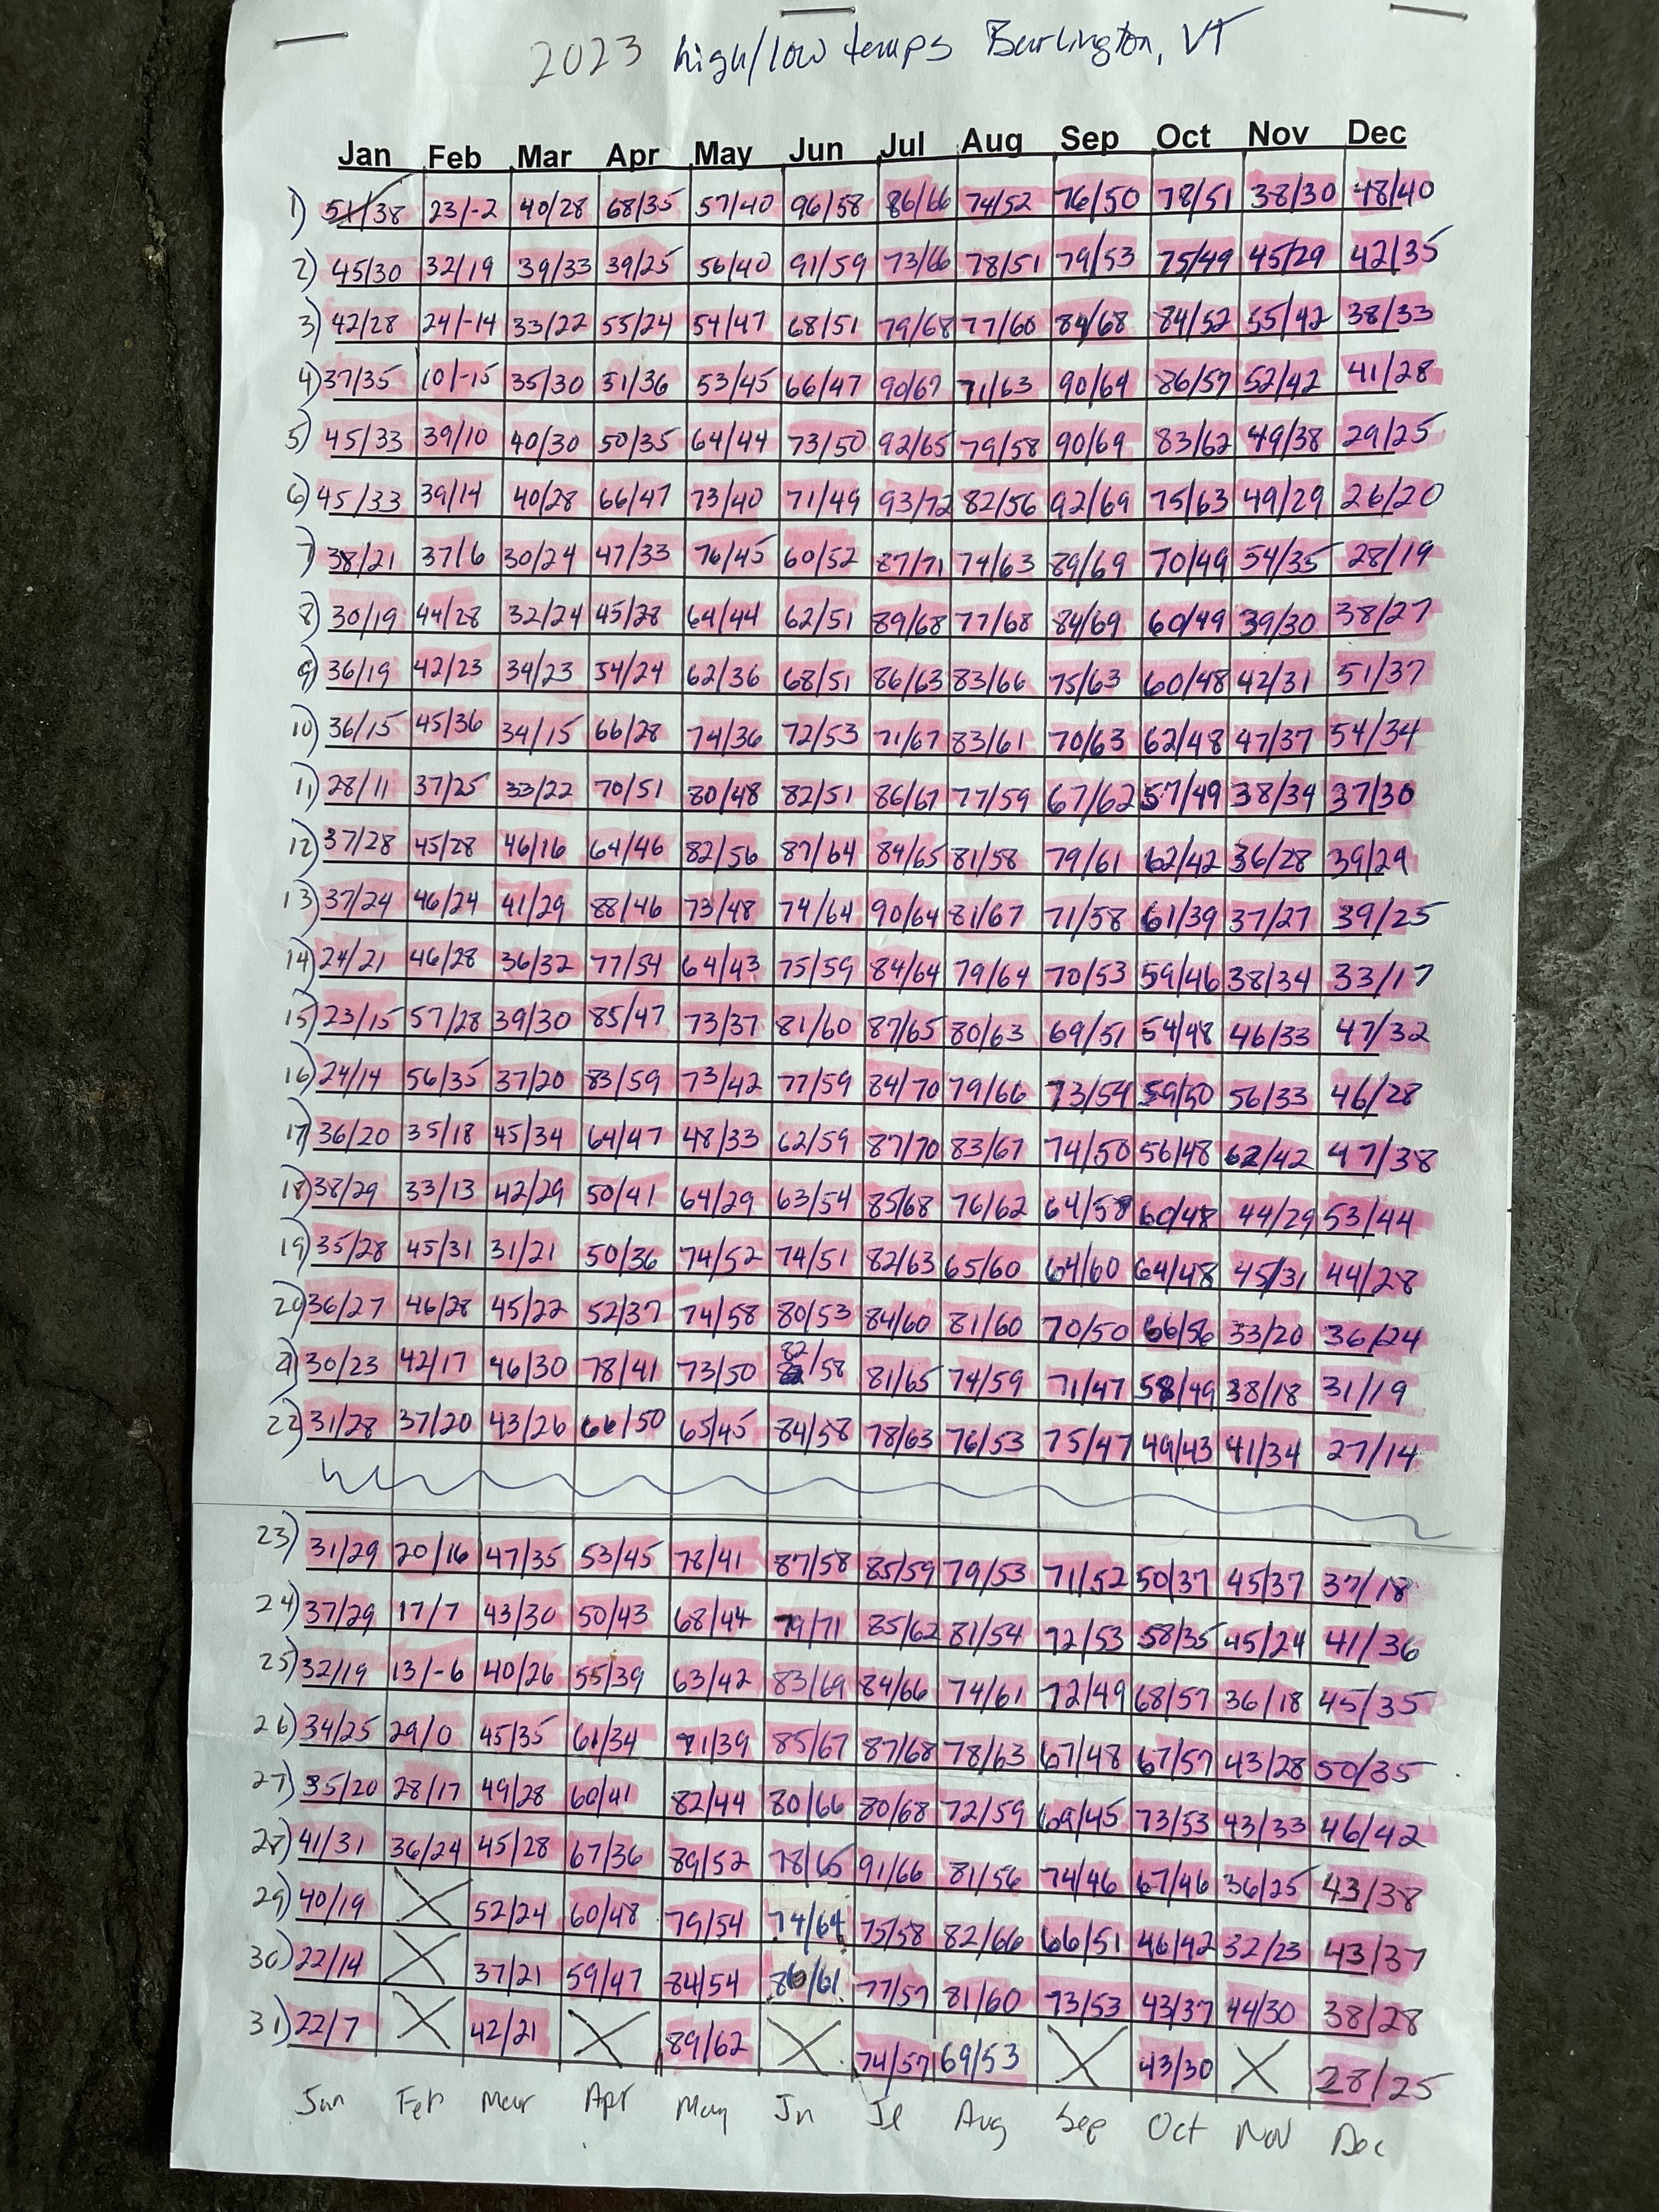
I source my daily data from the National Weather Service. Every few days or so, I sit down, record the temperatures on my data sheet, and translate the temps into needlefelted yarn.
Complete data sheet from 2023.
The holidays set me back a bit, but the temperature felting for 2024 is now complete. 2023, the first year I did this, was the warmest year on record for Burlington, Vermont, with an average temperature of 49.9 degrees Fahrenheit. The trend continued in 2024, with an average temperature of 50.9 degrees. According to vtdigger.org, this is about 8 degrees warmer than in 1924. And the top 10 warmest years on record in the state have all been from 1998 onward.
High and low temps, Burlington, Vermont, 2023 (left) and 2024 (right). In the 2023 piece, the highs are the circles and the lows are the surrounding square; in 2024, the upper triangles are the highs, the lower triangles are the lows.
The 2025 piece is prepped and ready to go.


